Dashboard
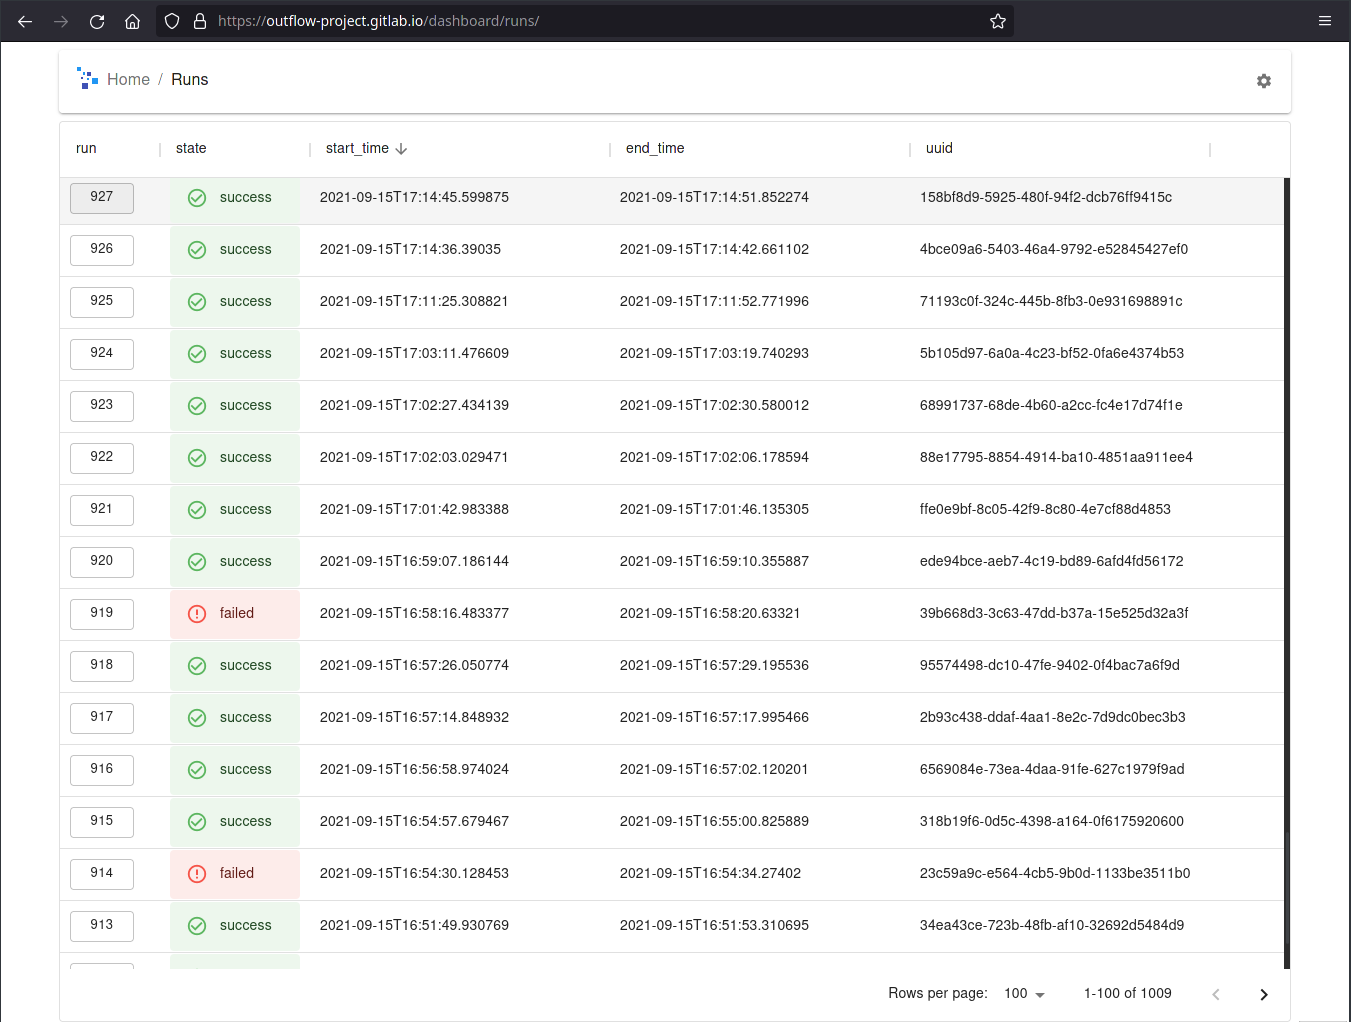
The outflow dashboard is a web interface where you can check the execution of your pipeline runs.
It is accessible at https://outflow-project.gitlab.io/dashboard/, but will probably be empty for now as it needs some setting up (see next session).
Set up Hasura
The dashboard uses hasura to query the run execution in database in real time. Hasura is compatible only with postgres databases, not sqlite.
You need to run an instance of hasura that can connect to you postgres database. You have two choices :
run hasura in docker on a machine that can access the postgres server using
network_mode: hostinside the hasura docker-compose file.run both hasura and your postgres server using the same docker-compose.
Then:
Go to the hasura console (usually http://localhost:8080/console)
Click on the
datatab.Click on Connect Database
Fill your database url
Click on
View DatabaseClick on
Track Allto track all tablesClick on the other
Track Allbutton to track relationships
Now you can head over to the dashboard and you should see your pipeline executions.
By default, the dashboard queries hasura in at the default address and port of hasura on the localhost. If you are running hasura with the default address and port you have nothing to do, else click on the gear icon in the dashboard to set the hasura url.
View the task workflow
You can see the workflow of task executed by a run by clicking on the run in the left column.